Blogs
Sign-up to receive the latest articles related to the area of business excellence.
Contour & Surface Plot
View All Blogs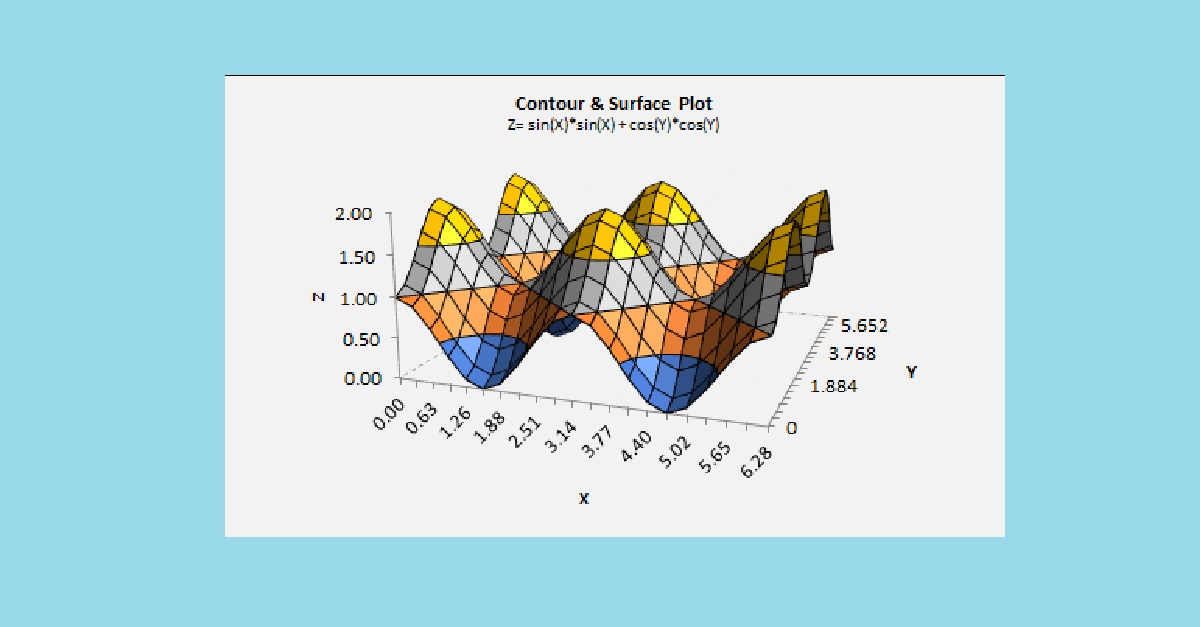
What is a contour plot?
If you have a response variable (say z) which is a function of one input variable (say x), then we can represent this mathematically as z = f(x). We can plot the variation in z with variation in x in a 2-dimensional line graph. However, if the response variable z is a function of two input variables (say x and y) then we can represent this mathematically as z = f(x, y). In order to plot the variation in z, we now need a 3-dimensions to plot the value of z with changes in x shown in one axis, changes in y shown in one axis and the resulting changes in z shown in a third axis. Such a plot is called a 3-d surface plot. A sample 3-d surface for z = sin^2(x) + cos^2(x) is shown below.
Sometimes, we may be interested in determining values of x and y which give the same or constant z values. This sort of a plot which is typically plotted on a 2-d plane is called a contour plot. The lines that represent constant z values are called iso-lines. For example, on a weather map for a given area, we may be interested in determining areas of high and low pressures. We would typically use a contour plot to represent such a figure. The lines of constant pressure are also called isobars. A sample 2-d contour plot for z = sin^2(x) + cos^2(x) is shown below.

Contour plots provide visual clues on what variables to select for X and Y in order to optimize the response function.
How to create contour and surface plot in Sigma Magic?
The contour and surface plot can be created within the Sigma Magic software by clicking on Contour Plot within the Graph menu. Click on Update Inputs to open the dialog box. Specify the name of the X axis variable (without any spaces or special characters), the minimum and maximum values of X and the number of increments to generate intermediate values of X. Similarly, specify the parameters for the Y axis. Note that the name of the Y variable should be different from the X variable. Finally, define the response variable name and the function model equation Z= f(x,y).
When you click on the OK button, Sigma Magic will generate values for the X and Y variables and the response Z variable using the specified model equation. If no equation is specified, you can also define the equation in the Z column on the worksheet. This will automatically create the 3-d surface plot. If you need the contour plot, you will have to select the graph and change the graph type to contour plot using Excel functionality.
How to interpret contour plot?
It is usually easier to interpret a 3d surface plot compared to a 2d contour plot. However, there are a few things to consider when looking at a contour plot.- Contour plots can indicate peaks or valleys within the range of X and Y at the center of concentric shapes.
- If the contour lines are spaced close to each other, then the values change rapidly while if the contour lines are spaced far apart then the z values change more slower.
- If there are multiple concentric shapes within the figure, then the figure usually points to a multi-modal distribution.
- Contour plots which contain no curves but straight lines may indicate a ridge shaped function or a planar surface (linear model).
Follow us on LinkedIn to get the latest posts & updates.
