Blogs
Sign-up to receive the latest articles related to the area of business excellence.
Are variables correlated?
View All Blogs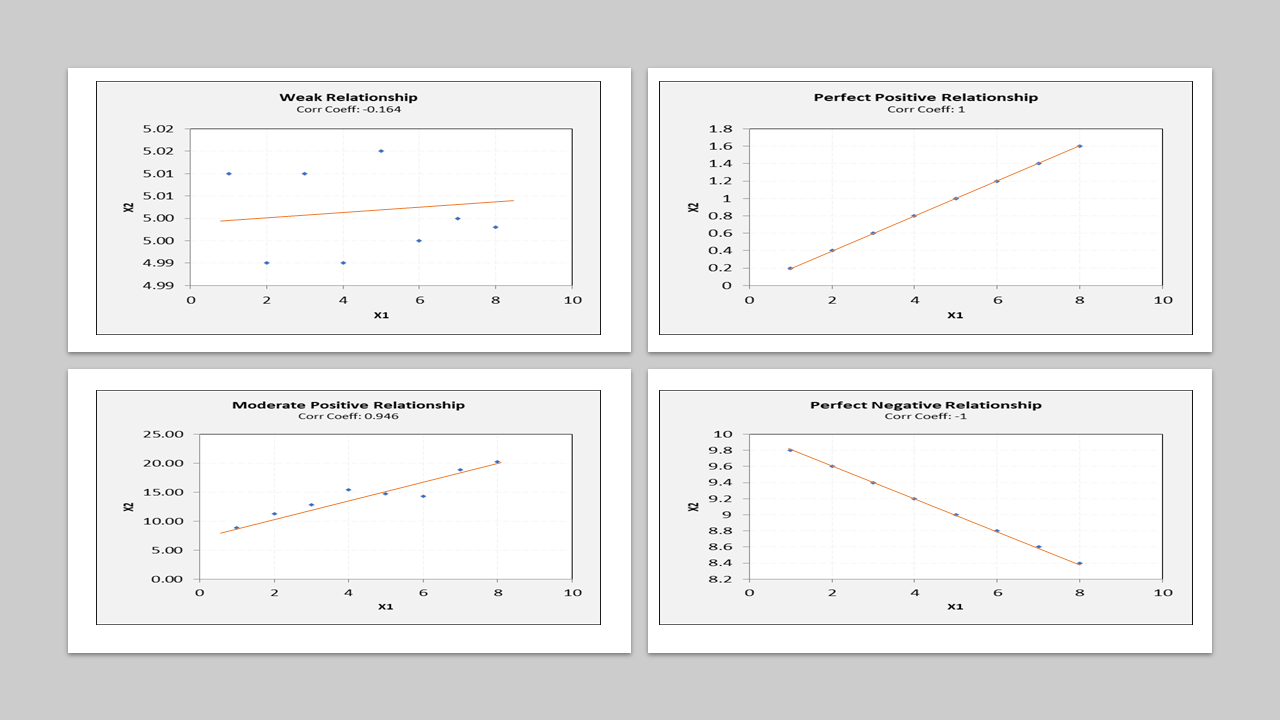
Correlation Coefficient
When we are building a model between our inputs (independent variables) and output (dependent variable), we would like to see that there is a strong correlation between our input(s) and output. If there is a correlation, then our model would be useful for predictions/optimization etc. However, for building a multiple regression model, we also want to make sure that the correlation between the input variables is not very strong – since we don’t want to duplicate the same information content between different input variables. One way for us to get an idea of the correlation between variables is to plot them on a scatter plot to visually look at the correlation to see if there is an identifiable pattern between the two variables. However, this is just a visual test and can be subjective. A more quantitative approach to detect if there is correlation between two variables is to calculate the correlation coefficient.The correlation coefficient is a statistical measure of the strength of relationship between two variables (X and Y). The correlation coefficient varies from -1 to +1. The correlation coefficient only measures the linear relationship between the variables. A value of +1 indicates a perfect positive relationship which means that for an increase in one variable, there is a corresponding increase in the other variable. A correlation coefficient of -1 indicates a perfect negative relationship which means that for an increase in one variable, there is a corresponding decrease in the other variable. A correlation coefficient of 0 implies there is no relationship between the two variables. The value of the correlation coefficient indicates the strength of the relationship. A value of 0.3 implies that there is a positive relationship, but it is weak. The following figures shows the correlation coefficient for several scenarios.

There are two methods for computing the correlation coefficient between two variables, one is looking at the linear relationship between the two variables (Pearson’s correlation coefficient) and the other is to comparing the ranks to check if the relationships are monotonous (most commonly the Spearman’s rank correlation coefficient).
Pearson Correlation Coefficient
When applied to a population, the correlation coefficient is represented by the Greek letter ρ (rho) and when applied to the sample, the correlation coefficient is represented by the English letter r. The formula to compute the correlation coefficient is:
Note that the correlation formula is symmetric, hence, the correlation coefficient between X and Y is the same as the correlation coefficient between Y and X.
Spearman’s Rank Correlation
Spearman’s rank correlation coefficient is a non parametric measure of correlation between two variables. While Pearson’s correlation assesses linear relationship, Spearman’s correlation assesses monotonic relationships. A relationship is monotonous if an increase in one variable also results in an increase in the other variable (though the absolute value of the increase is not important only the ranks are important). The Spearman correlation between two variables is equal to the Pearson correlation between the rank values of those two variables. Spearman’s correlation is appropriate for both continuous data and discrete ordinal variables. In the figure below, the correlation coefficient is still 1.0 even though the relationship is not linear since the relationship between the two variables is monotonously increasing.Examples
- Correlation between the age of an employee and the reported level of income
- Correlation between a high calorie diet and the weight of the participant
- Correlation between the heights of father and son
- Number of advertisements vs. purchase intention
- Sales of air conditioners vs. temperature in the city
- Number of study hours vs. grades
When do we use Pearson vs. Spearman?
If both the variables X and Y are continuous, then most likely we will use the Pearson correlation coefficient as it is more commonly and widely understood. However, if one or both of the variables are ordinal, then we would use the Spearman correlation coefficient. We would also use Spearman if we are not interested in establishing a linear relationship between the variables but are only interested to understand if there is a monotonous relationship. Does an increase in one variable correlate with an increase in the other variable.
Hypothesis Test
You can also perform a hypothesis test to determine if the population is correlated based on the sample statistics. The hypothesis in this case would be:
For this test if the P value is significant (less than alpha), then we would conclude that we reject the null hypothesis and accept the alternative hypothesis. If the P value was high (greater than alpha), then we would accept the null hypothesis.
Threshold Value
It is hard to put a threshold value to say, all values above 0.8 would be a strong correlation between two variables. The generally, accepted threshold range could range from 0.7 in some instances to 0.9 or greater in other instances. It depends on the application that is being considered. When there is a lot of noise in the data, even getting a correlation coefficient of 0.7 would be considered good enough to indicate a strong relationship and when there is not much noise in the data and we are looking at physical laws say the relationship between voltage and current, then the correlation coefficient needs to be a lot higher (greater than 0.95) in order to consider it as a strong relationship.Correlation and Significance
We have two values that given us a clue about correlation between two variables: the correlation coefficient (rho) and the statistical significance value (P). Let’s look at four possible outcomes:- Correlation is high and P value is high: In this case, even though we are showing a high correlation but we cannot conclude statistical significance due to the large P value. The observed correlation coefficient may just be for the sample and we cannot extrapolate it to the population. We should probably increase the sample size to get more details about this case.
- Correlation is high and P value is low: In this case we would conclude that there is a strong correlation and that it is statistically significant.
- Correlation is low and P value is high: In this case, we would conclude that there is no correlation between the two variables.
- Correlation is low and P value is low: In this case, we would conclude that even though there is a weak correlation between the two variables, the correlation is statistically significant and the correlation cannot be ignored if it is practically significant.
Correlation with Multiple Variables
The correlation coefficient is usually carried out for 2 variables. However, if there are more than 2 variables (say X1, X2, and X3) then the correlation is determined between each pair of variables. The correlation between a variable and itself (say X1 and X1) is 1.0. We compute the correlation between X1 and X2, correlation between X2 and X3, and correlation between X1 and X3. If any of these correlations have a high correlation coefficient and the P value is significant then we would conclude that that pair of variables are correlated.Correlation vs. Causation
Just because two variables have a high correlation value does not mean causation – that is X causes Y. For example, if you were the compute the correlation between the population of India and China for the last 10 years, you would find a high correlation coefficient but we cannot conclude that the population of China is caused by the population of India. If there is a high correlation between calorie diet and diabetes, it does not mean that diabetes causes a high calorie intake (but maybe the vice-versa may be possible).Example
Data shown in the table shows the electricity consumption and number of cars produced at a given factory. Perform a correlation analysis to determine if there is any relationship between these two variables.
Solution: Let’s calculate the Pearson’s and Spearman’s correlation coefficient for this example. For the Pearson’s correlation coefficient, we have a value of 0.896. Since the P value is low, we conclude that the coefficient is statistically significant.

For the Spearman’s correlation coefficient, we have a correlation coefficient of 0.853. We have a similar conclusion that the coefficient is statistically significant.

Follow us on LinkedIn to get the latest posts & updates.
