Blogs
Sign-up to receive the latest articles related to the area of business excellence.
How do we measure the degree of departure from normality?
View All Blogs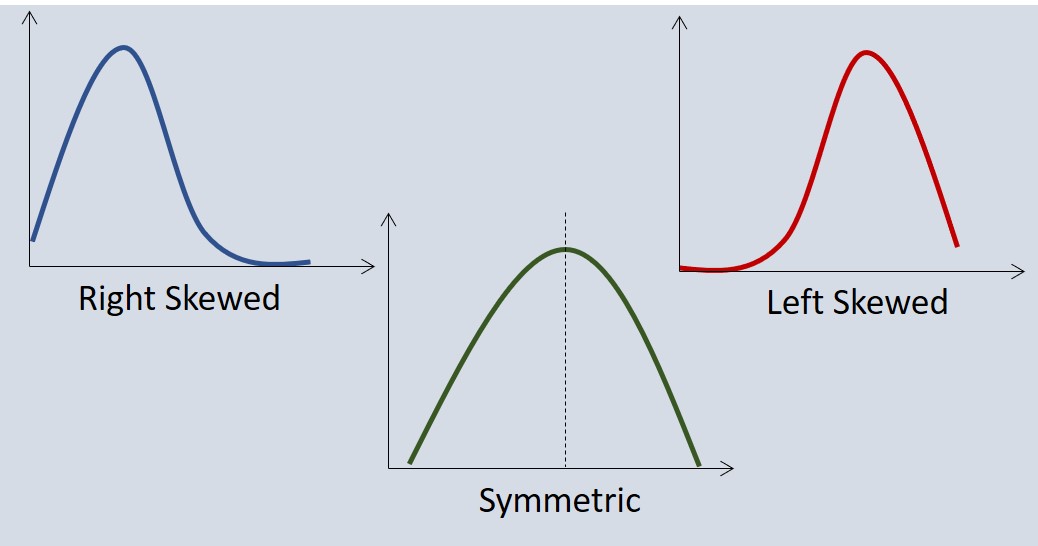
How do we know if our data is normally distributed or not? We can of course look at its histogram but that is just a visual indicator. Is there any way in which we can quantify the degree of departure from normality to describe the shape of the histogram? In this blog, we will look at two additional measures the Skewness and Kurtosis of a data set. We will understand what they mean, how to calculate and interpret them. We will also discuss some of the limitations of these measures that we need to watch out for when we use them.
Introduction
When we describe our data using statistical measures, we usually report the mean, median, range and standard deviation. Sometimes, we can use additional measures to describe the nature of the distribution of the data. We can describe how the distribution of the data looks like. The shape of the distribution of the data can be ascertained graphically by looking at its histogram. We can compare the shape of the histogram to a normal distribution to see how close to normal the distribution is. There are two statistical measures that compare the shape to the normal curve called Skewness and Kurtosis. In this blog, we will try to understand these measures and when we can use them.Theory
Skewness is a statistical number that tells us if a distribution is symmetric or not. A distribution is symmetric if the right side of the distribution is similar to the left side of the distribution. If a distribution is symmetric, then the Skewness value is 0. If Skewness is greater than 0, then it is called right-skewed or that the right tail is longer than the left tail. If Skewness is less than 0, then it is called left-skewed or that the left tail is longer than the right tail. For example, a normal distribution has Skewness = 0 since it is a symmetric distribution. There are a few different formula used to calculate Skewness in literature but we will use the formula given below. Note that you need at least 3 data points to calculate Skewness and the sample standard deviation (s) should not be zero.
Kurtosis is a statistical number that tells us if a distribution is taller or shorter than a normal distribution. If a distribution is similar to the normal distribution, the Kurtosis value is 0. If Kurtosis is greater than 0, then it has a higher peak compared to the normal distribution. If Kurtosis is less than 0, then it is flatter than a normal distribution. There are a few different formula used to calculate Kurtosis in literature but we will use the formula given below. Note that you need at least 4 data points to calculate Kurtosis and the sample standard deviation (s) should not be zero.

Application
Let’s look at some Skewness and Kurtosis values for some typical distributions to get a feel for the values. In the first data set, the data was generated from a normal distribution so both Skewness and Kurtosis are close to 0. For the second data set, the data was generated from a uniform distribution, the Skewness is still close to 0 as it is symmetric, but since it is more flatter than a normal distribution, the Kurtosis value is negative. The third data set was generated from a Log Normal distribution, which is not symmetric and is skewed to the right, so the Skewness value is greater than zero. It also has a higher peak compared to a normal distribution, hence has a Kurtosis value greater than 0. Finally, the last data set was generated from a Weibull distribution and is skewed to the left, so the Skewness is less than 0 and the Kurtosis is close to 0. Normal Distribution (Skewness = 0.16, Kurtosis = -0.23) Normal Distribution (Skewness = 0.16, Kurtosis = -0.23) |
 Uniform Distribution (Skewness = 0, Kurtosis = 1.4) Uniform Distribution (Skewness = 0, Kurtosis = 1.4) |
 Log Normal Distribution (Skewness = 2.7, Kurtosis = 11.2) Log Normal Distribution (Skewness = 2.7, Kurtosis = 11.2) |
 Weibull Distribution (Skewness = -0.7, Kurtosis = 0.7) Weibull Distribution (Skewness = -0.7, Kurtosis = 0.7) |
Software
Sigma Magic: Using the Sigma Magic software, calculating the Skewness and Kurtosis is relatively straightforward. Just add a new Basic Statistics template to Excel by clicking on Stat > Basic Statistics. Copy and paste the data for which you want to Skewness and Kurtosis into the input area and then click on Compute Outputs. The analysis results will include the Skewness and Kurtosis values.Excel: You could also calculate these values in Excel by using the formula =SKEW(…) for the Skewness value, =KURT(…) for the Kurtosis value.
Minitab: If you use the Minitab software, you can copy and paste the data into Minitab and then click on Stat > Basic Statistics > Display Descriptive Statistics. Then select the data column and then click on OK. This will print out the quartiles for the sample values. If you want the Skewness and Kurtosis values, you have to go back to the menu and click on Statistics and select the checkbox next to Skewness and Kurtosis in the statistics options. Note that the values provided by Minitab may be slightly different from Excel and Sigma Magic software.
Exercise
Calculate the Skewness and Kurtosis for a given data set in Excel file: Basic Stats 1.Using the Sigma Magic software, the Skewness value is 1.6 and Kurtosis is 2.4 indicating that it is skewed to the right and has a higher peak compared to the normal distribution.
Follow us on LinkedIn to get the latest posts & updates.
