Blogs
Sign-up to receive the latest articles related to the area of business excellence.
Is my measured data acceptable?
View All Blogs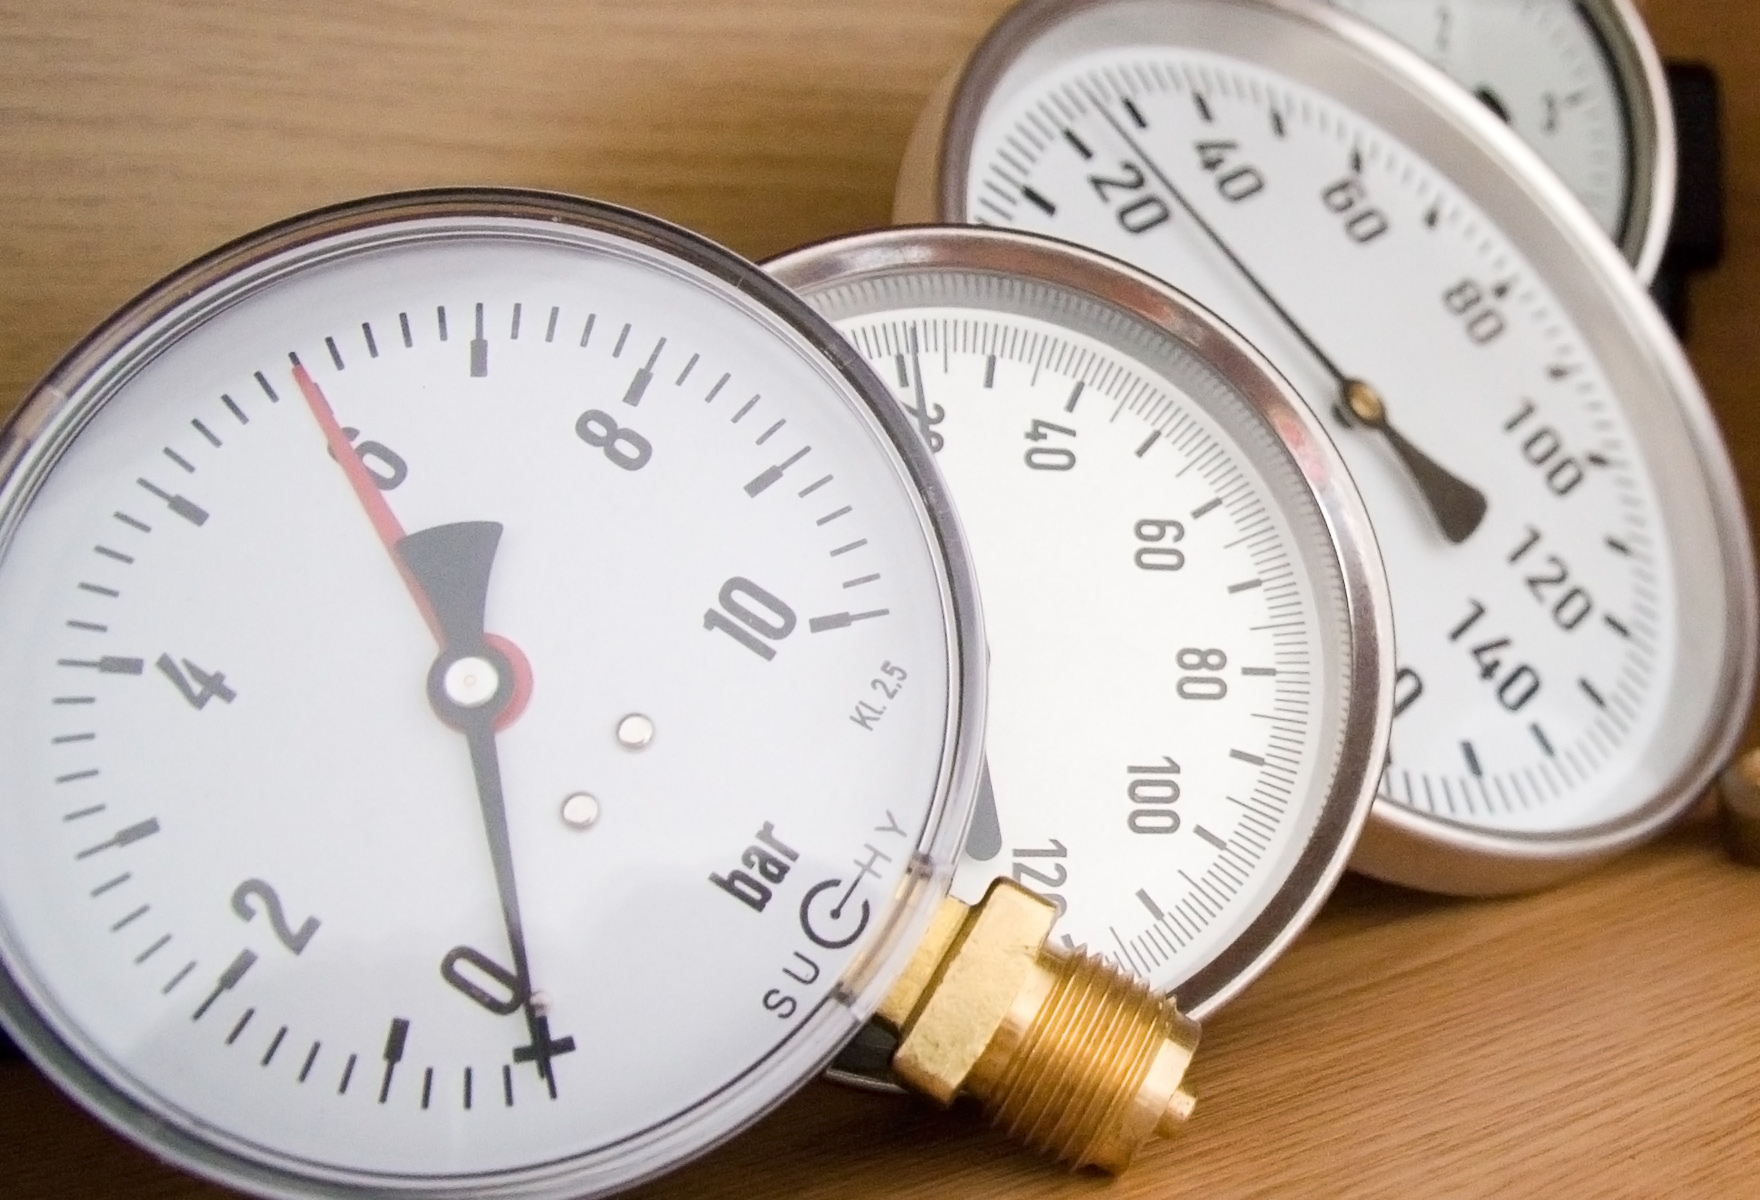
We keep saying that we need to use facts and data to make decisions but ensuring that we have good data is important to make sure that we are making good decisions. Measurements Systems Analysis (MSA) is an experiment that we perform to check our measurement system and determine the amount of errors present in the measured data. Before we start using any data, it is important we check if the data is reliable, otherwise we may be making wrong decisions based on bad data. In this module, we will focus on measurement errors for continuous metrics such as length, temperature, pressure, etc.
When we check any measurement system, there are several things we need to check to ensure a good measurement system.
- The measuring instrument should have adequate discrimination and sensitivity
- The measurement system should be in statistical control - only impacted by common cause variation
- The measurement system must be accurate - close to the true value
- The measurement system must be precise - small variation in the measured readings

Example
Let’s say we have two measuring instruments A and B. As an example, these could be pressure gages that are used to measure the pressure in a cylinder. Let's assume for a moment that we know the true pressure in a cylinder to be 100 bar. Let's assume for this example that the customer defined tolerance for the pressure of the cylinder should be between 95 and 105 bar. We would like to understand if these instruments have any measurement errors. In order to determine these errors we have to perform a test. Let's say we use the same two instruments to measure the pressure inside a cylinder and we repeat the experiment three times. The readings given by these two instruments are shown in the table below. What can we conclude from this experiment? Looks like neither of these two instruments does a relatively good job measuring the pressure inside this cylinder but we would like to quantify the measurement errors so that we can compare and contrast the two instruments.
First, we check the resolution of the instrument. If the instrument is able to read a difference of 0.1 bar and our customer tolerance is 10 bar (105-95), we would say that the resolution or discrimination of the instrument is sufficient for our purpose. Let's also assume that this instrument is in statistical process control - you would have to use a control chart to determine if the readings output by the instrument are in control - we will not cover control charts in this module.
Next let's check for accuracy - is it giving the correct value or close to the correct or true value on an average? The last check is whether it is consistent and repeatable - in the sense that is the variation between readings small? From this table, we can see that measuring instrument A is precise (since it has less variation) but it is not accurate (as the true reading is different from the average measured value). However, the measuring instrument B is accurate (since its true value is close to the average measured value) but it is not precise (has more variation). In order to check for accuracy, we need to have an independent estimate of the true value of the part. This process of comparing the measured results to an external standard is called calibration. The difference between the average measured value and the true value is termed as bias and the % error is termed as accuracy. Ideally, we want the instrument to be accurate with 0% accuracy error. The formula for determining accuracy error percentage is:

For this example, the accuracy error of instrument A is 1.9% and for instrument B is 0%. The second metric that we can use to quantify the measurement errors is called precision or variation. The percentage error due to variation is computed by comparing the total variation due to the measuring system with some external reference or standard. Typically, we might use historical readings to get an idea of the amount of variation from part to part that we have seen in the past or we can compare this variation to the total acceptable tolerance for this measurement as defined by the customer. The total absolute measurement variation can be reported as the range or the maximum minus the minimum value of the measurements. If you know the standard deviation of the measurements, then six times the standard deviation will also give you an estimation for this range. In this example, the measurement variation is 0.1 bar for instrument A and 2 bar for instrument B. The precision error is usually expressed as a percentage of the customer tolerance (Upper Specification Limit minus the Lower Specification Limit). One formula that we can use to report measurement variation or precision is as follows:

Hence, the precision error for instrument A is 1% (0.1 * 100/10) and for instrument B is 20% (2 * 100/10). For a good measurement system, the accuracy error should be within 5% and precision error should within 10%. Of course, these also depend on your application and for more critical applications where the cost of making a mistake is large, you can choose more conservative values for the acceptable limits (say 1% accuracy error and 5% precision error) and for situations where the measurements are not very critical, you could relax the acceptable limits (say 10% accuracy error and 30% precision error).
In order to determine the amount of variability in our measured readings, the precision is further broken up into two components Repeatability and Reproducibility. Repeatability error refers to difference in reading obtained when we are using the same instrument and the same person measuring the part multiple times. Reproducibility error refers to difference in readings obtained when different people are measuring the part using the same instrument. The combination of repeatability error and reproducibility error is usually called the Gage R&R.
How do we perform MSA?
The first step is to look at the measurement system to determine where the possible sources of error may occur. Typically, measurement error occurs during correctly interpreting the measuring instrument, data entry, manipulation of numbers, or reporting. Setup the measurement system analysis at the most likely place where the error may occur.Check Accuracy
Use the following steps to check the accuracy of the measuring instrument.- Select parts that span the range of variation of the process
- Measure the parts using the measuring instrument in random order
- Repeat the measurements a few times to see if you are getting similar readings
- Obtain the “true” values of the parts using a calibrated instrument
- Compare the two values to determine accuracy of the measuring system.
Check Gage R&R
Use the following steps to check the precision of the measuring instrument.- Select 5-10 parts that span the range of variation of the process
- Ask multiple operators to measure the parts in random order
- Ask the operators to repeat the measurements again in random order
- Enter these values into a software package to estimate the % Gage R&R.
Improving the MSA Results
If the MSA results are not acceptable, then consider the following actions to improve the measurement system.- Ensure that data was correctly captured and entered for analysis. Sometimes, we have data transcribing errors which may reflect a poor MSA.
- Have the operator re-measure the outliers to see if they are consistent in their findings. This may point to a faulty instrument or a faulty measurement.
- Contact the supplier of the gage to see if we are currently using the measuring instrument. Ensure that the gage is calibrated.
- Ensure proper standards are being followed by the operators during measurement. Training may need to be provided to the operators if required.
- Ensure proper use of tools and fixtures, lighting etc. to minimize the influence of environmental conditions on measurement errors.
Conclusion
Always check your data before you use the data to make decisions. Checking the measurement system involves conducting an set of experiments to determine the amount of measurement error that the instrument has. If the measuring instrument is both accurate and precise, document the amount of errors you have found for this instrument in your report before you use the measurement data for your analysis. You may also want to consider performing an analysis of the impact of the measurement errors you have found on your conclusions. If the measurement errors are too high and not acceptable, you cannot continue with your project using the data from this measuring instrument. You will need to take actions to reduce the measurement errors if possible or replace the instrument if required.References
- AIAG MSA Standard: https://www.aiag.org/store/publications/details?ProductCode=msa-4
Follow us on LinkedIn to get the latest posts & updates.
