Blogs
Sign-up to receive the latest articles related to the area of business excellence.
Things to consider before deploying control charts
View All Blogs
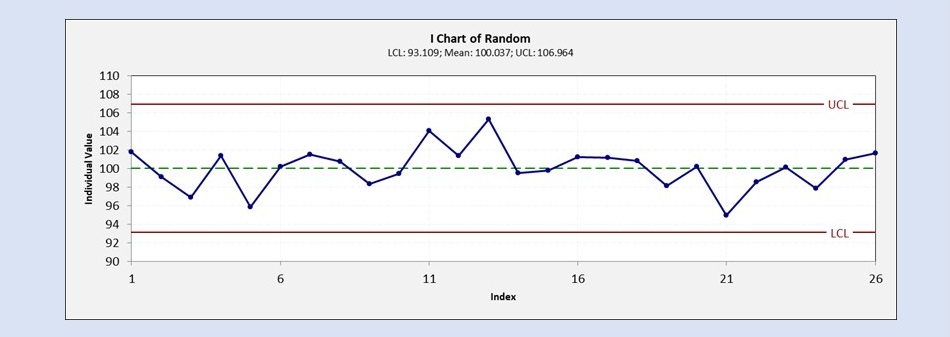
Let’s say that you have come up with a new process and you have deployed that process in your company. The process could be anything – from a simple process for how your sell your products to your customers or how you enter orders into your system or a complicated process of manufacturing and assembling a critical component to tight tolerances. How do you ensure that your process continues to run the way it was designed? One option is to design the process in such a way that mistakes cannot happen in the first place – say through automation or any other means. If you are 100% sure that there can be no chance for errors to creep in, then you don’t have to worry about your process and you can let it run rest assured that it will perform as intended. However, the real world is not so forgiving – if the process contains human elements then mistakes could happen. Similarly, if we are relying on automation, automation may fail under certain conditions. Hence, if it is critical that our process performs as intended, there is no option but to measure the critical parameters on a regular basis to ensure that the process is performing as intended. However, when you start the measuring process there are two considerations. First, is the measurement precise and accurate – is it reflecting reality. This is a topic for another discussion. Let’s assume that our measurements are reliable and truly reflect what is happening to the process. Now, the next question is whether the process is performing as intended. Note, that all processes have variation, it is practically impossible to get the same readings all the time and your measurements will also show variation. Now, the question is if you do see variation in your measurements, should you be alarmed that something is amiss or should you ignore the variation with the hope that it will come back to its original value? When should you take corrective action? If you don’t take corrective action when it is required, then you are letting the process run out of control and the results are less than expected. If you don’t need to take corrective action because the variation that you are seeing is the natural variation in the process, you may actually make the process worse by taking corrective action when none is required. A control chart helps you make this determination using statistical principles. It lets you know when the variation is caused by common cause or natural factors and you have nothing to worry about and when the variation is caused by special causes or extraneous factors and you are expected to take a corrective action. By implementing control charts in the right way, you can ensure that your process continues to stay in control and you continue to derive the benefits of the process you have put in place for a long period of time. Here are some factors to consider when designing and implementing control charts:
- What are the variables that you need to track and monitor to ensure that process is in control? Should you only measure the outputs or should you also measure the inputs?
- What type of data is appropriate for creating control charts? How do you handle cases when the data is continuous and when it is discrete?
- What is the right frequency to collect the data for your control charts? Should you collect the data every hour, every day, every week, every fortnight, or every month?
- How much data should you collect each time you decide to collect the data? Is one data point sufficient, how about 5 or 50?
- Who should collect the data to ensure that the process is in control?
- What control chart should you use to determine if the process is in control? What are the different options available and when do you use which option?
- How often should you update the control limits that you use to determine if a process is in control?
- How are you going to display these out-of-control situations to your workforce? Is it okay to display these out-of-control charts in your work area?
- What actions are you going to take if the process in in control? How do you communicate and train your organization to act on these processes?
- What are some best practices and lessons learned from other people who have deployed control charts that you can learn and leverage from?
Follow us on LinkedIn to get the latest posts & updates.
