Blogs
Sign-up to receive the latest articles related to the area of business excellence.
What are quartiles and where do we use them?
View All Blogs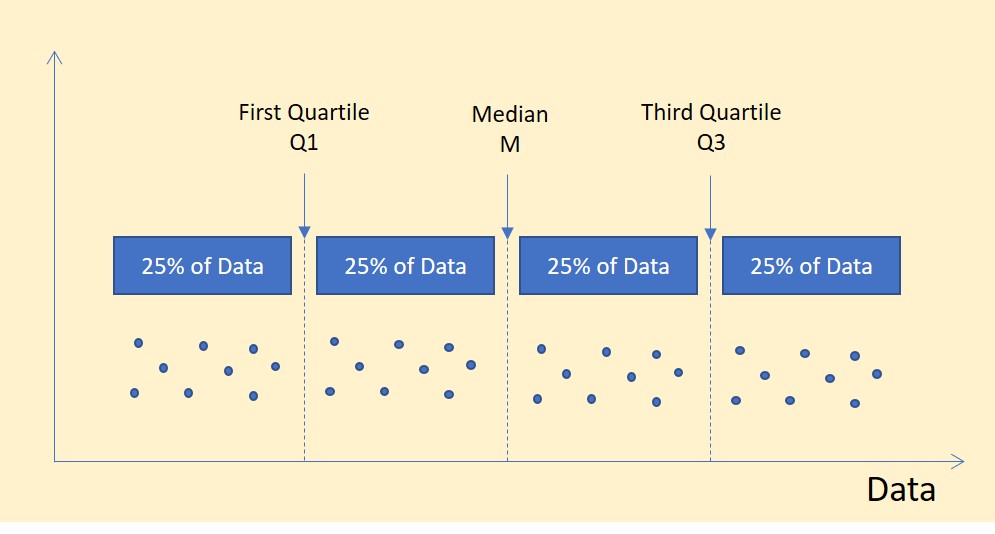
What are the quartiles and what is the Interquartile Range (IQR). How do we calculate these values? Where are they used and why do I need to know about them? In this article, we will understand what they are and how we can calculate them and describe where they are typically used.
Introduction
In order to understand IQR, we first need to understand Quartiles (Q1, Q2, and Q3). Let’s say you got 89% marks in an exam. Looks like you did not get close to 100% so others may think your performance is not as good. But in fact, you actually came first in the class. The only reason you did not get 100% is because the exam had tough questions that no one in the class was able to answer. So, if you mention that you were 1st in class, then people understand that you did pretty well in the exam. So, even though you did not get 100% (percent), you are in fact the 100th percentile. That is 100% of the people in the class (excluding yourself of course) are behind you! So, when we say 75th percentile, that means that 25% of the people in the class did better than you and 75% of the people in the class did worse than you. Similarly, 50th percentile means that half the class did better than you and half the class did worse than you. It does not really matter how much you score but only the relative score you achieve compared to the rest of the class.Theory
So, when we talk about quartiles, we are dividing the data set into 4 quarters. Each quarter is 25% of the total number of data points. The first quartile or Q1 is the value in the data set such that 25% of the data points are less than this value and 75% of the data set is greater than this value. The second quartile or Q2 is the value in the data set such that 50% of the data points are less than this value and 50% of the data set are greater than this value. The third quartile or Q3 is the value such that 75% of the values are less than this value and 25% of the values are greater than this value. The term Interquartile Range (IQR) refers to the difference between Q3 and Q1 (IQR = Q3 – Q1).Let’s now calculate the IQR value for an example data set. Let’s say we have 11 data points as shown below:
Data Set: 5, 4, 2, 1, 7, 9, 8, 10, 12, 0, 15
The first step is to put the data in increasing order, we get the following…
Sorted Data Set: 0, 1, 2, 4, 5, 7, 8, 9, 10, 12, 15
If there are N data points, each quarter will contain (N+1)/4 data points. Since there are 11 data points, in our example we have 3 data points in each quarter. So, the first quartile is the value that is located at the 3rd data point (Q1 = 2 in this example). The second quartile is the value that is located at the 6th data point (Q2 = 7 in this example). The third quartile is the value that is located at the 9th data point (Q3 = 10 in this example). Hence, the IQR = 10-2 = 8.
How do we handle the case when the number of data points is not divisible by 4! In this case, we have to use interpolation to calculate the value of the quartile. Let’s say we have N = 5 data points, where the data set is as follows:
Data Set: 23, 45, 12, 18, 50
In this example, the first quartile is at the location (N+1)/4 = 1.5th data point. Hence, the first quartile is the value between the first and second data set. Hence, in this example, Q1 = (23 + 45)/2 = 34.
In summary, in order to calculate the quartiles, we first put the data set in increasing order and then calculate the quartiles as follows:
Q1 is the value of the data set located at the (N+1)/4th location, Q2 is the value of the data set located at the (N+1)/2nd location, and Q3 is the value of the data set that is located at the 3*(N+1)/4th location.
Application
Some examples of the use of range in the real world are: temperature ranges for the day as reported on a weather report, min/max levels of water in a reservoir. However, in the presence of outliers, the range values can be significantly influenced by them. Hence, we prefer to use the IQR instead as we “ignore” the bottom 25% of the data points and the top 25% of the data points. IQR statistic is more robust with respect to outliers. In the presence of outliers, IQR is a better representation of the amount of spread in the data rather than the range. Some companies use the quartiles to benchmark other companies. For example, the median company pay for a given position is set at the first quartile of the top 20 companies in that region. The quartiles and IQR information is typically used when you create a box-plot of your data set.Software
Using the Sigma Magic software, calculating the quartiles and IQR is relatively straightforward. Just add a new Basic Statistics template to Excel by clicking on Stat > Basic Statistics. Copy and paste the data for which you want to calculate the quartiles into the input area and then click on Compute Outputs. You could also calculate these values in Excel by using the formula =QUARTILE(C9:C28,1) for the first quartile, =QUARTILE(C9:C28,2) for second quartile, and =QUARTILE(C9:C28,3) for the third quartile. Note that Excel values may not match Sigma Magic and Minitab values as it uses a slightly different algorithm to calculate the quartiles. If you use the Minitab software, you can copy and paste the data into Minitab and then click on Stat > Basic Statistics > Display Descriptive Statistics. Then select the data column and then click on OK. This will print out the quartiles for the sample values. If you want the IQR value, you have to go back to the menu and click on Statistics and select the checkbox next to IQR in the statistics options.Exercise
Calculate the quartiles and IQR for the data set given in the following Excel file: Basic Stats 1.Using the Sigma Magic software, the analysis results will include the quartiles and IQR value. For this example, the first quartile Q1 = 29.25, the second quartile Q2 = 31 (also called the median), and the third quartile Q3 = 32. The Interquartile range IQR = 2.75.
Follow us on LinkedIn to get the latest posts & updates.
